Heavy-Ion Facilities
Beam generation and delivery process
Beams are initially generated in the FRIB ion sources and then accelerated before delivery to the SEE experimental areas. Highly charged ions are produced with an electron cyclotron resonance (ECR) ion source. Beam species are selected in the injector beamline by mass-to-charge (M/Q) ratio for further transport and delivery. Beam species with non-overlapping mass-to-charge values are selected to ensure elemental purity and delivery of single LET values to devices.
Beam uniformity and homogeneity
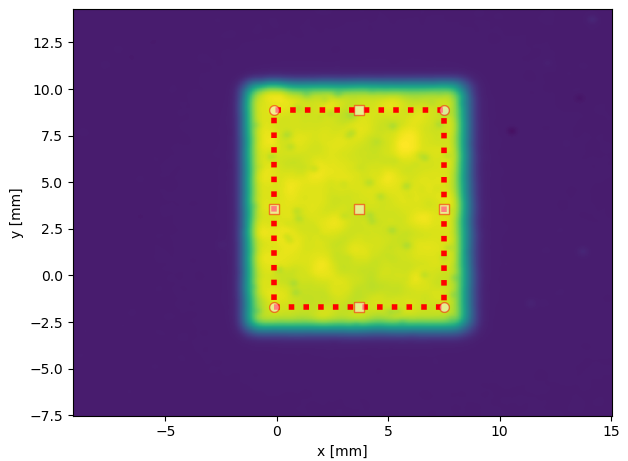
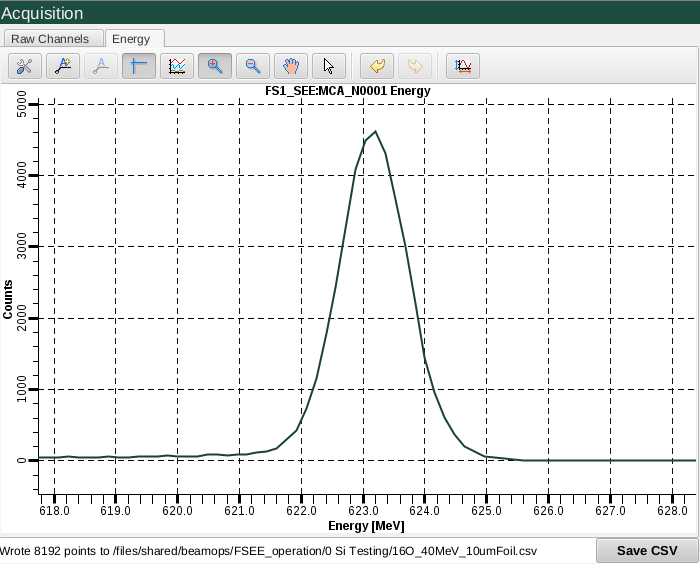
Beams are manipulated to provide uniform fluence over a maximum spot area of approximately 20 x 20mm2 or 40 x 40mm2at the target device location. Smaller spots down to 1 x 1mm2 can be produced on request. Inhomogeneity of the beam distribution is typically <10%. Beam purity is determined with a 50mm diameter Si (Li) detector, pre-amplifier, shaper, and multi-channel analyzer (MCA), which provide a spectrum of intercepted beam energy. Contaminant species are evident as additional peaks.
Beam format
In nominal operation, the beam is provided continuously with a 99.5% duty factor, 100Hz repetition rate, and a 9.95ms pulse duration (0.05 ms gap every 10ms). For efficient acceleration in the RF linear accelerator the beam carries a 40.25MHz bunch structure. Users may request different pulse structures for different experimental needs. Different pulse repetition frequencies may also be generated (e.g. 1Hz, 5Hz, and 100Hz).
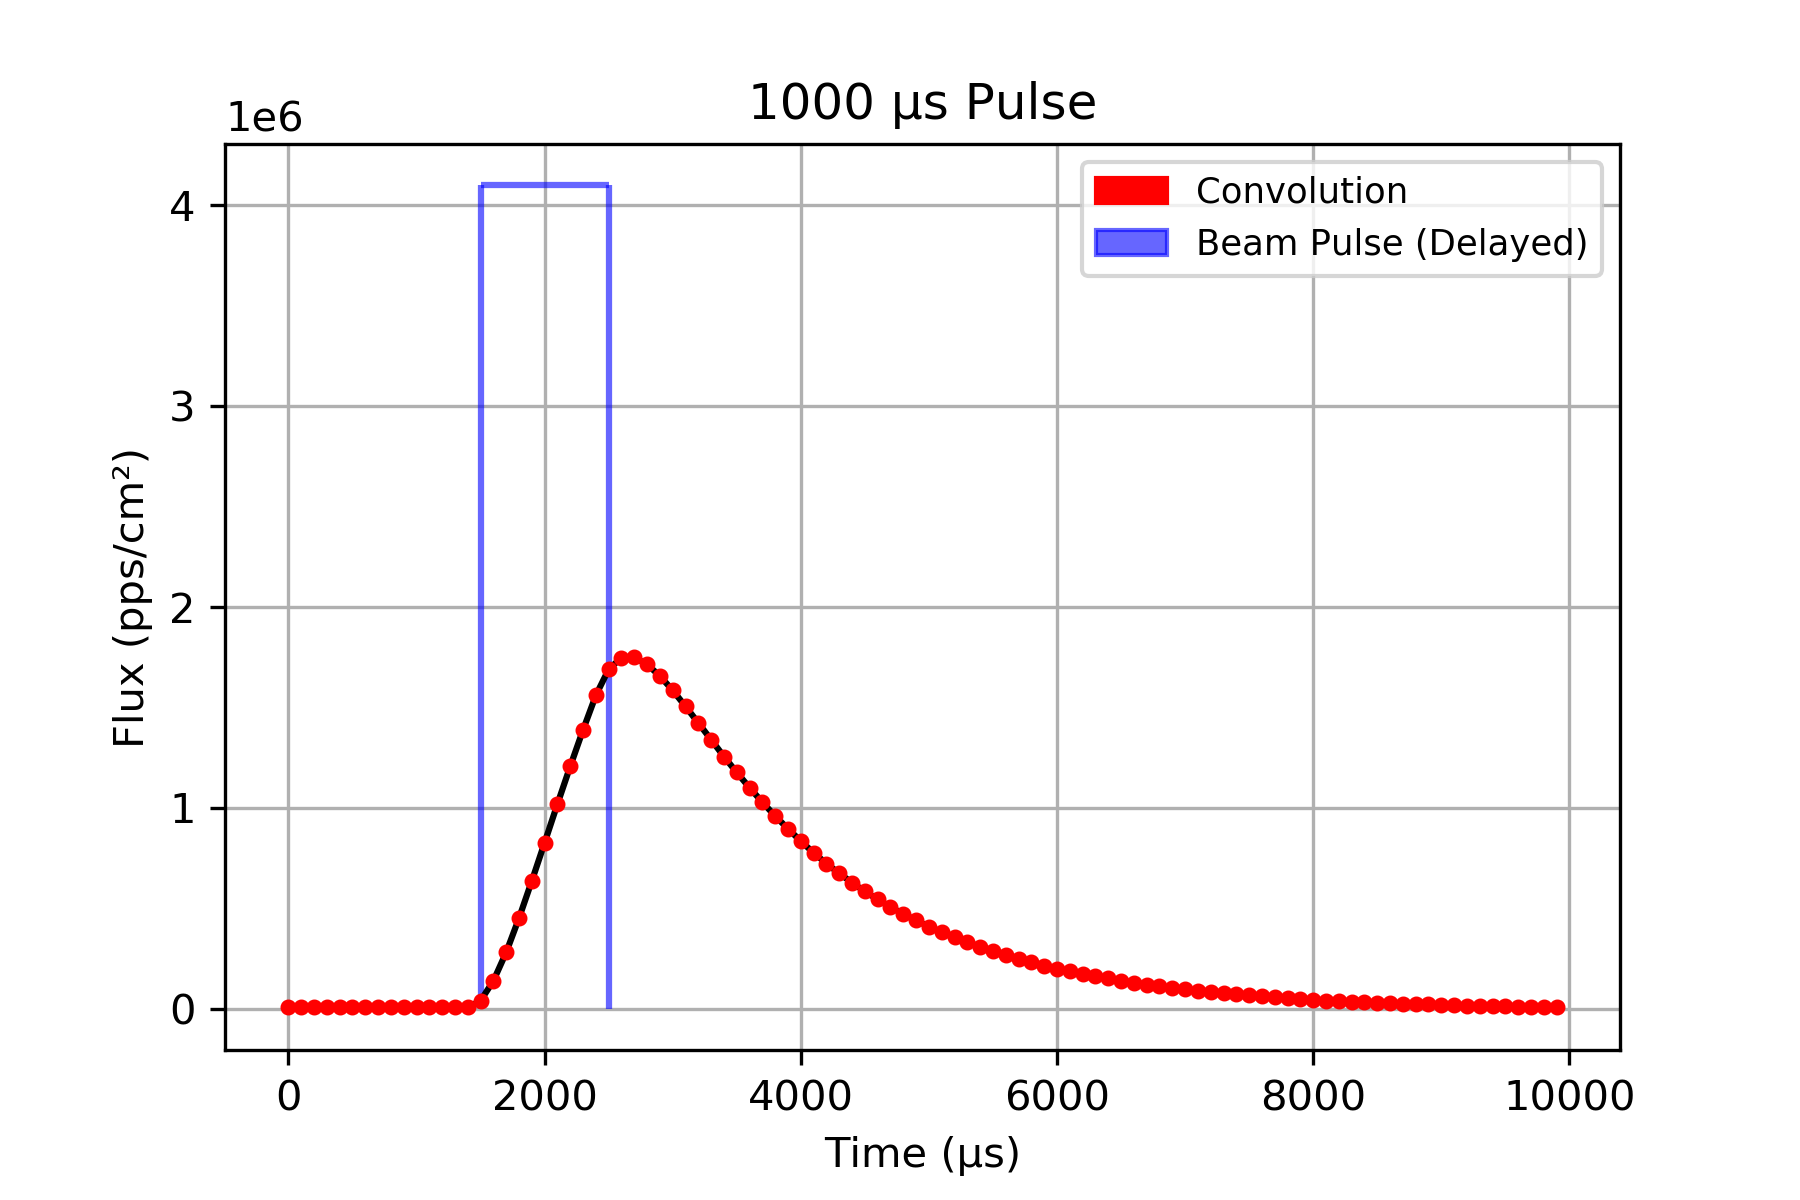
Based on linac operations, FSEE also offers single pulse beam format, delivering high intensity beam to DUTs with pulse duration ranging from 10 ms to 1 µs. Beam pulses can support flux ranges up to 1012 particles/sec/cm2 for light ions. Dosimetry measurements are performed with sensitive picoammeters that incorporate a ~120-Hz input bandwidth, but conserve overall charge for an accurate measurement of single-pulse fluence. Single pulses may be chained together at repetition rates of 1, 5, 10, 25, and 100 Hz, being delivered until a desired total fluence is met or a determined number of pulses have been completed. Contact SEE staff to discuss special beam format requests. Below is a beam pulse and its convolution from a single 1000 μs pulse of 40Ar with a peak flux of 4.1E6 pps/cm2 and total fluence 4028 particles/cm².
Get in touch
Contact SEE staff to discuss special beam format requests.
Energy degradation
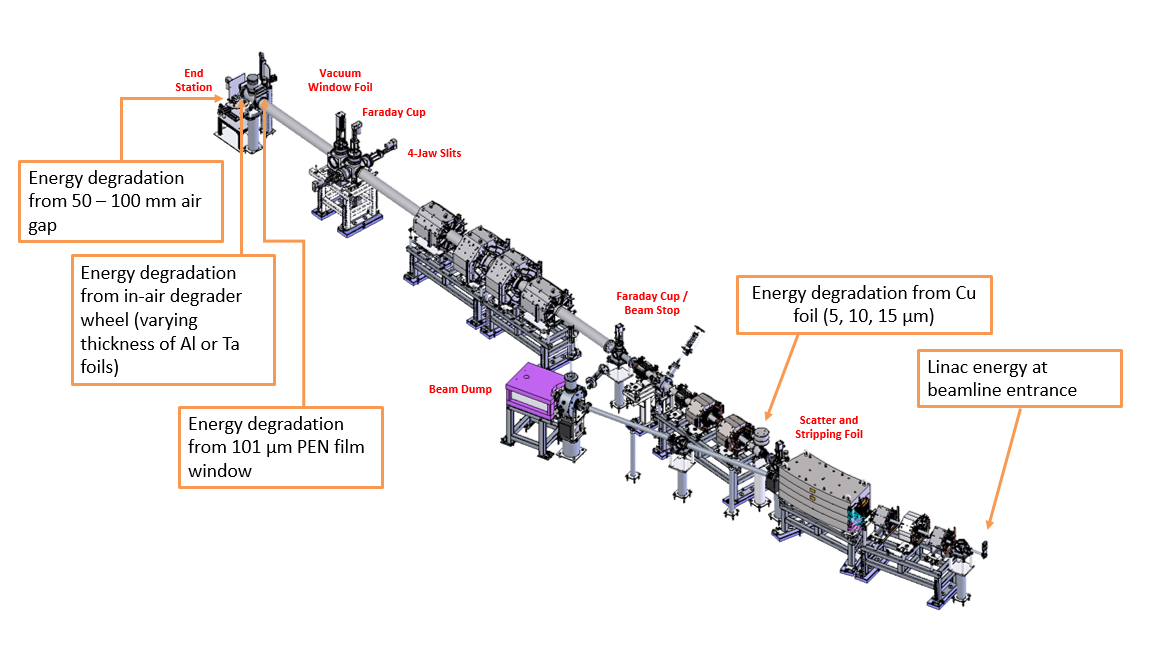
Energy degradation is provided by various means. The facility modes of energy degradation are set by beam tuning parameters and consist of copper foils of thickness 5, 10, and 15μm, and polyethylene naphthalate (PEN) vacuum window. User modes of energy degradation include a variable air gap from 30 – 100 mm and a remotely-operated degrader wheel at the end of the FSEE beamline. The degrader wheel system nominally consists of several aluminum foils of varying in thicknesses, however users may bring custom degrading material to use as well. KSEE uses multiple in-vacuum ladders of degrader foils.
Below is a diagram of the FSEE beamline outlining the energy degradation points.
Exposure selection and control
Beam species, energy, and flux changes are conducted by FRIB operators at the request of SEE users. Users can control insertion of degrader foils for energy attenuation. Users are given control of a beam shutter in order to manage beam exposure time. Various beam exposure settings are offered included maximum fluence, run time, and maximum dose. Exposure settings can be set by users from the SEE user control rooms at any time during exposure runs. A timing signal synchronized with beam on/off is available both at the experimental area and the user control room. The signal is generated in VLTTL format, with BEAM_OFF = 0V and BEAM_ON = +3.3V when terminated to high impedance, or +1.7V when terminated with 50 Ω.
Beam dosimetry and reporting
Various beam parameters are monitored during exposure. Ion species and charge states are initially known from the ion source and charge selector upstream of the SEE beamline. Flux density is determined by multiple points. A Faraday cup and viewer is used to establish the upstream flux density, and a scintillator establishes the flux density at the target.
Energy, energy spread, and beam purity are measured. Silicon PIN diodes measure the particle mass spectrum. Beam energy is established using linac instrumentation. Intensity and flux stability monitors are provided by the 4-Jaw slit current readback into a sensitive picoammeter.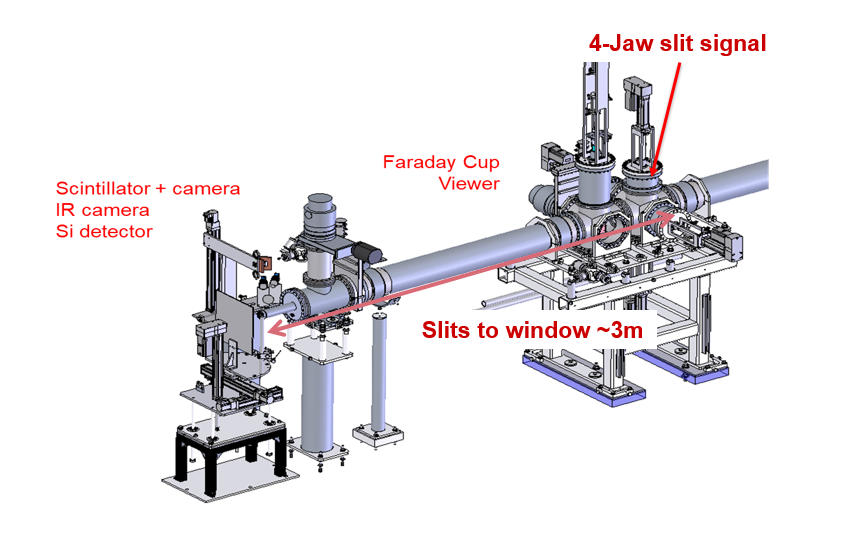
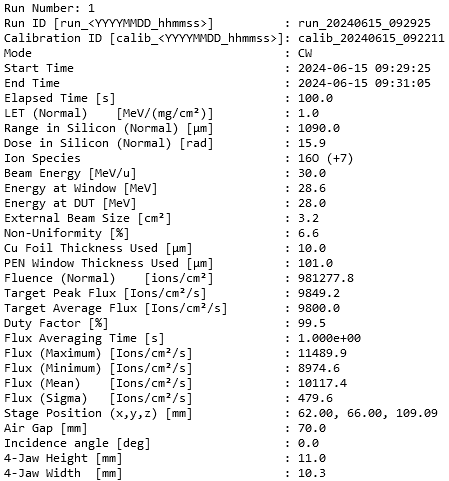
Real time dosimetry monitoring and reporting is provided to users. Dosimetry reporting collects individual exposure runs into "batches." Batch reports are emailed to the user point-of-contact person on demand. Reports may be generated singly, or in batches to reduce instances of email. Reports are generated in txt format and in Matlab-compatible formats. Both versions are provided on demand when reports are generated. All data is archived and time stamped. Below is an example of a typical run report generated.
SEE experimental areas
The experimental areas are established at the end of the SEE beamlines. The experimental area allows space for user equipment, includes workbenches for assembly and verification of work, and supplies local AC power 120V, 15A - with additional wall power configurations available upon request. Remotely controlled power is also available. Grounding points and ESD mats are located throughout the experimental area.
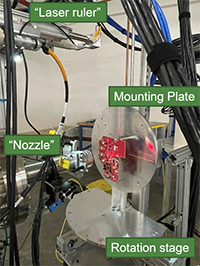
User devices are attached to one of several available mounting boards (see downloads for board patterns). The mounting board will be prepositioned to allow ease of access and sufficient clearance from the beam exit window (“nozzle”). A window cap is placed over the nozzle before any work begins for the safety of the users and equipment. Lightweight devices may be placed on the rotation stage to support instrumentation or testing. An air powered heating element is also available.
The sample holder can be up to 15 inches x 15 inches, and the device stand supports Texas A&M University (TAMU) and Lawrence Berkeley National Laboratory (LBNL) mounting hole patterns. The sample holder can be variably placed between 30 – 100 mm from the beam window. The holder has allowed movement of ±7.5 inches both horizontally and vertically and can support rotation in yaw. The position of the holder is known to within 100 μm and its rotational orientation is known to within 1 degree of accuracy. The mounting plate is 3/8” thick and is supported with four #10-24 x ½” mounting screws for attachment to the vertical stand. The holder supports a maximum load of 30 lbs. Larger apparatus can be used with prior discussion and planning. Users may attach their own mounting board or contact the SEE staff if they wish to make any changes to the mounting scheme.
Two line laser elements are provided to assist with aligning elements to the beam axis (shown below). A third laser is also available to measure air gap distances and to calibrate the position of user DUTs. . These are remotely powered from user inputs.
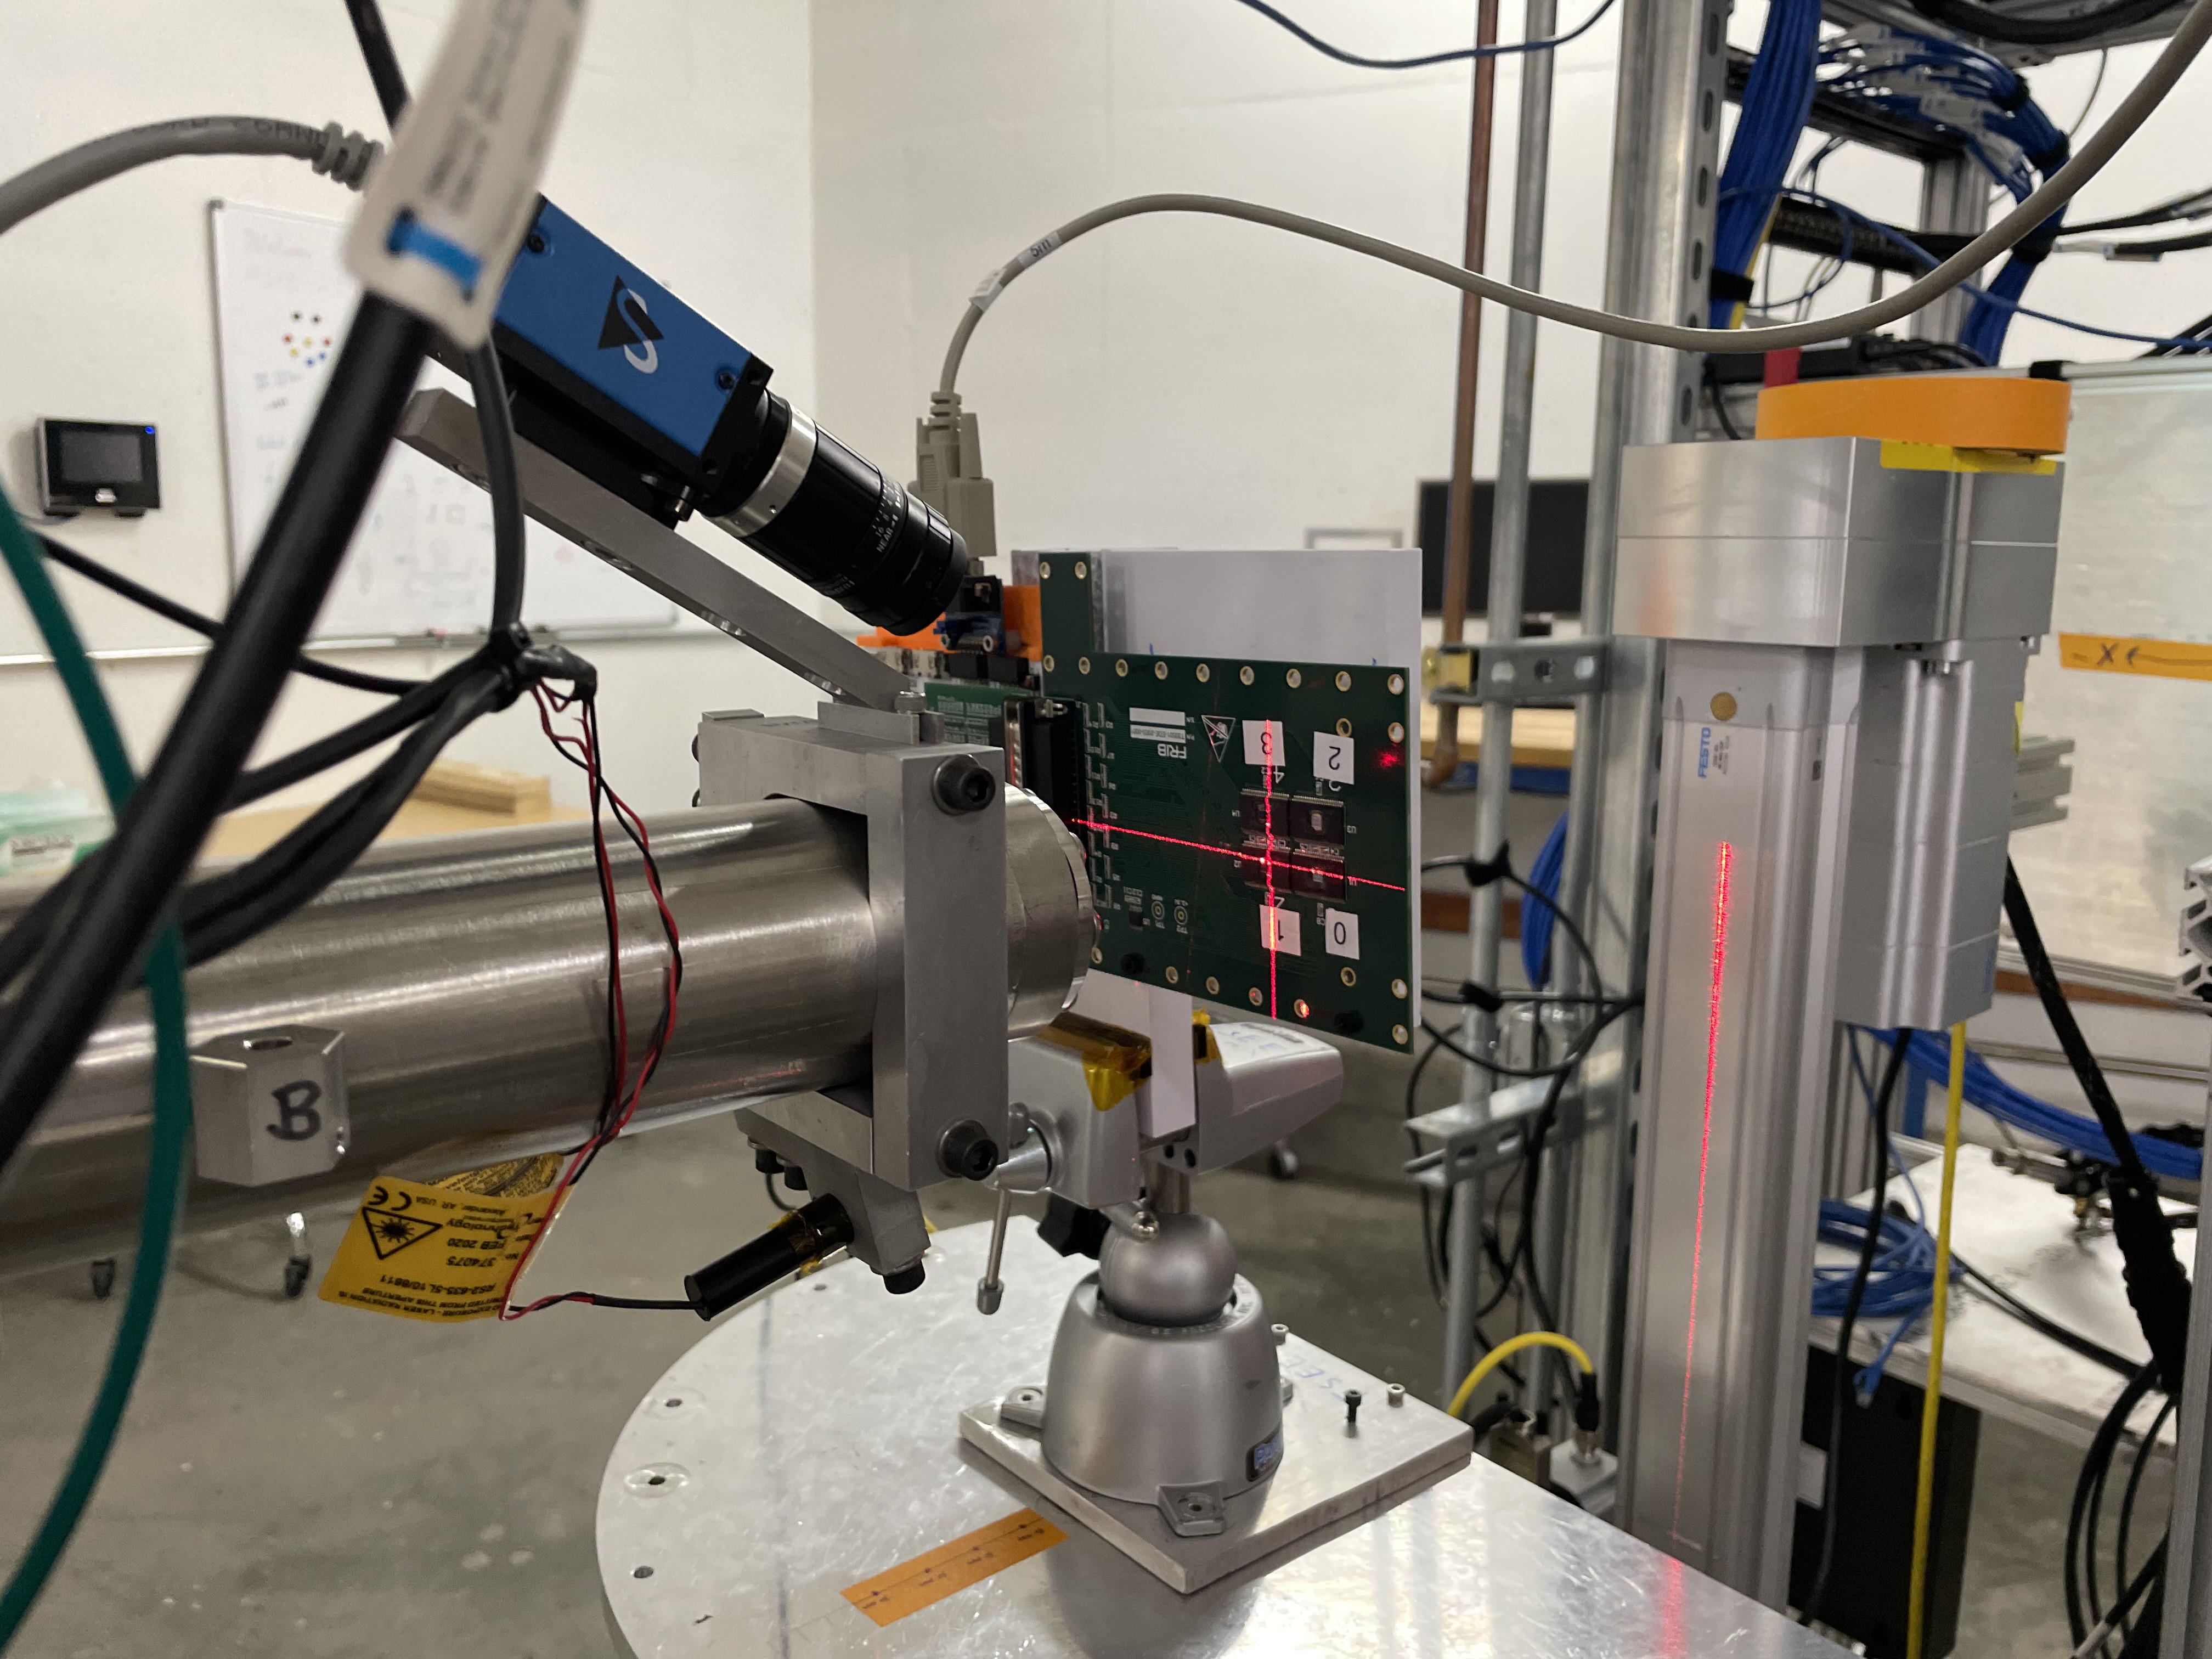
Touchscreen controls are provided for users at the beamline to facilitate position and transition between separately-mounted devices. Identical controls are employed in the SEE user control rooms. Laser crosshairs are aligned to the beam axis to verify horizontal/vertical (x,y) position. The distance from the window to the front surface of the mounting plate is calibrated and selected as the ‘z’ coordinate. A laser ruler is in place that measures air gap distances up to 100 mm.
User control room
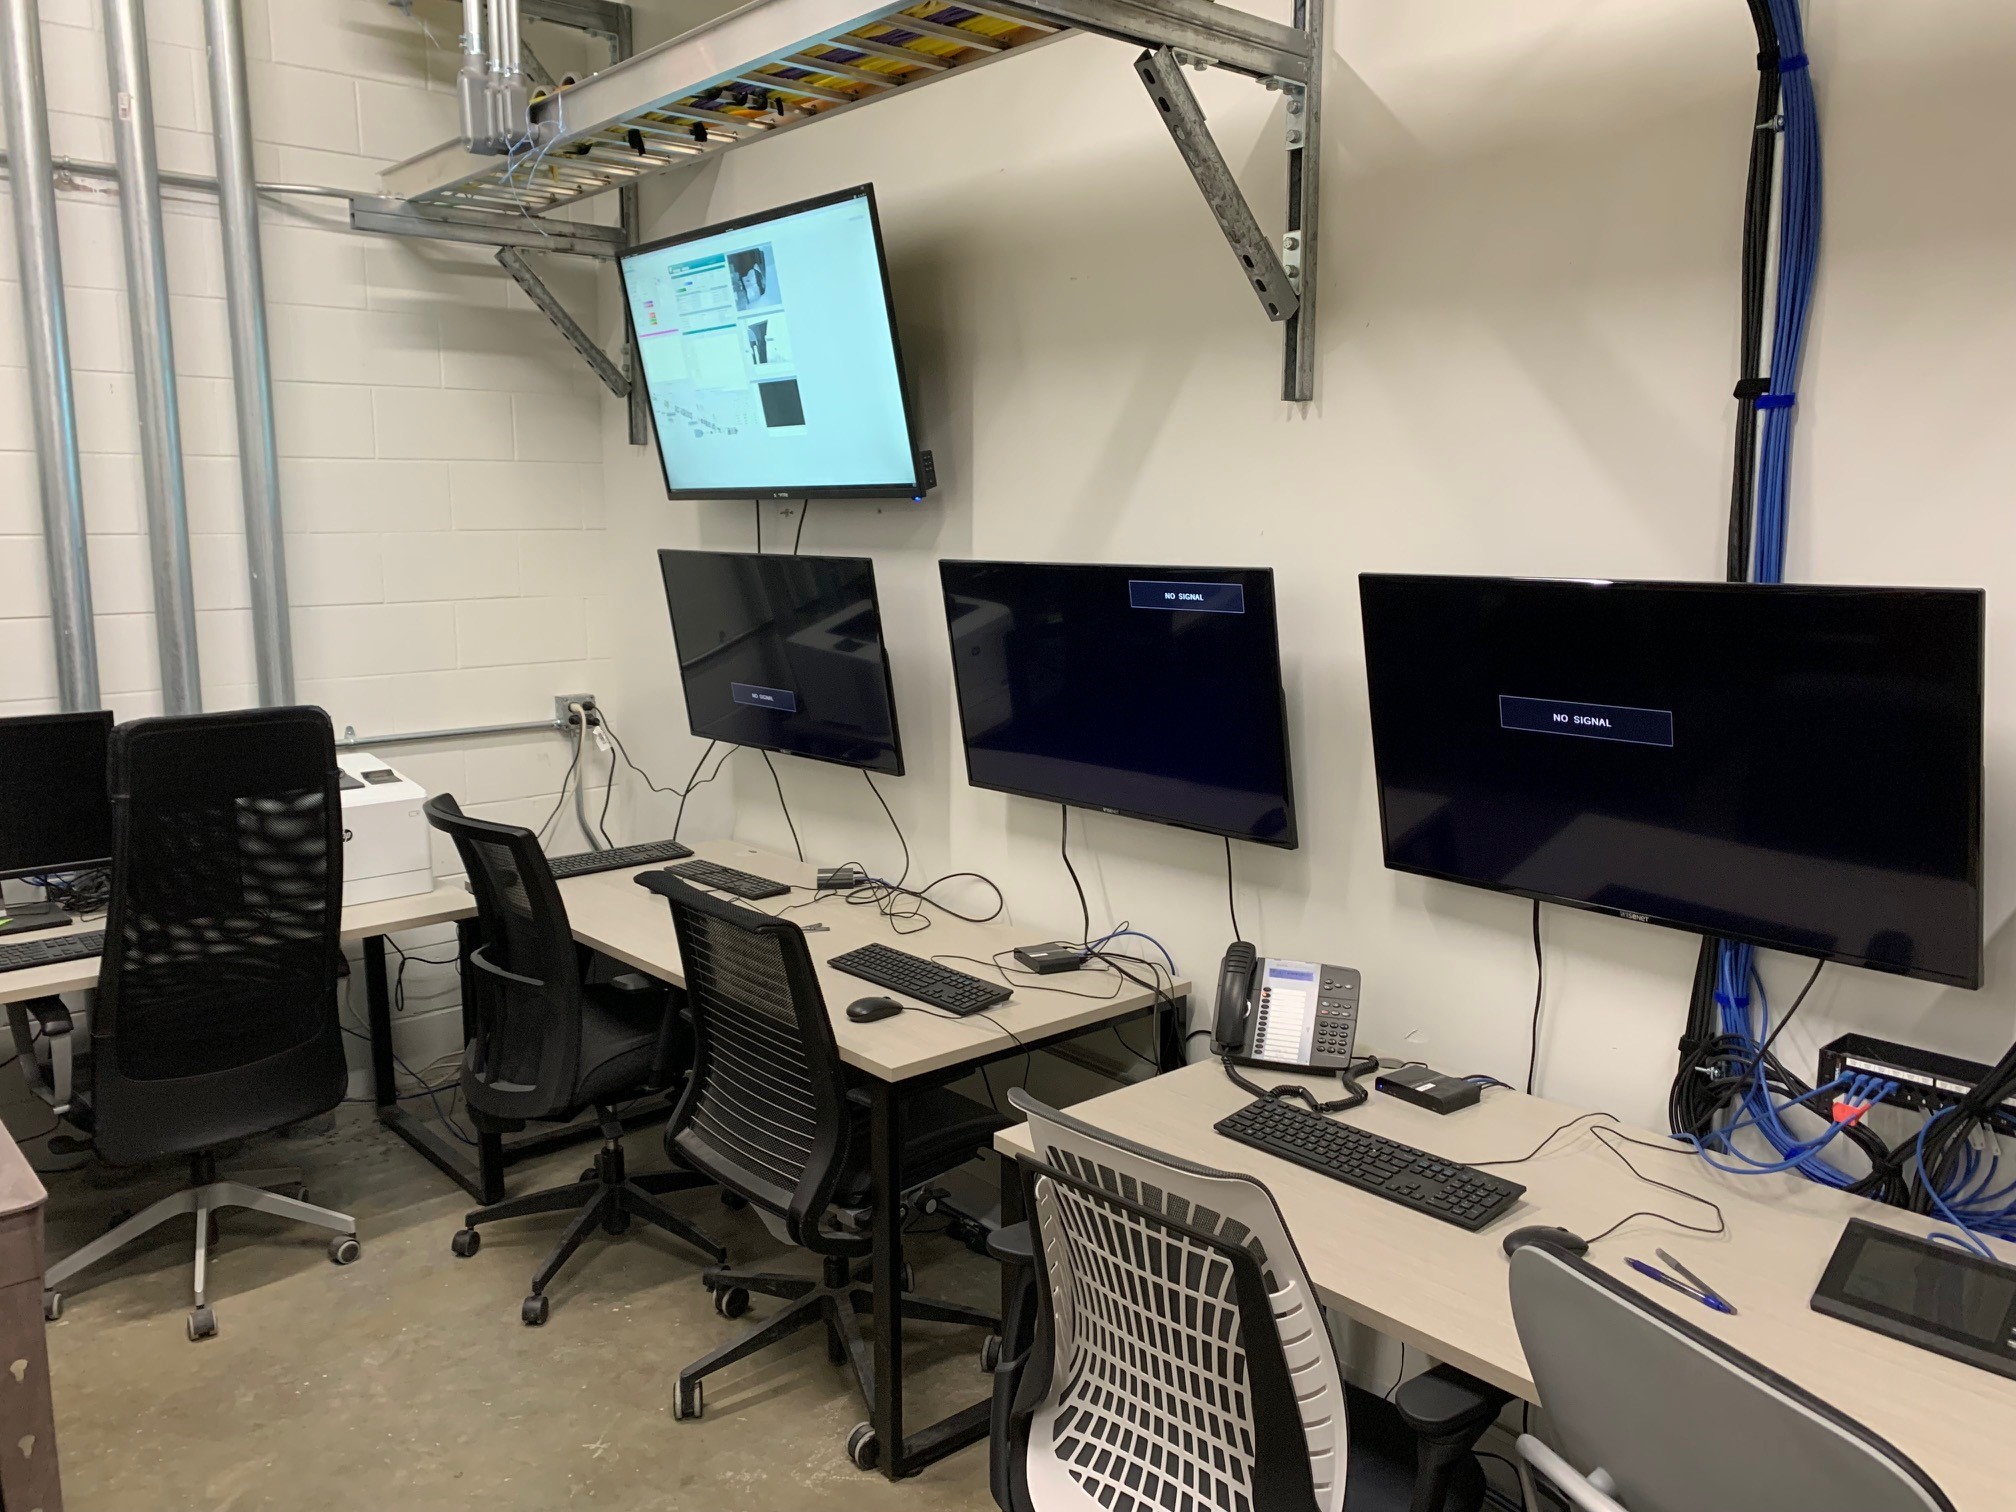
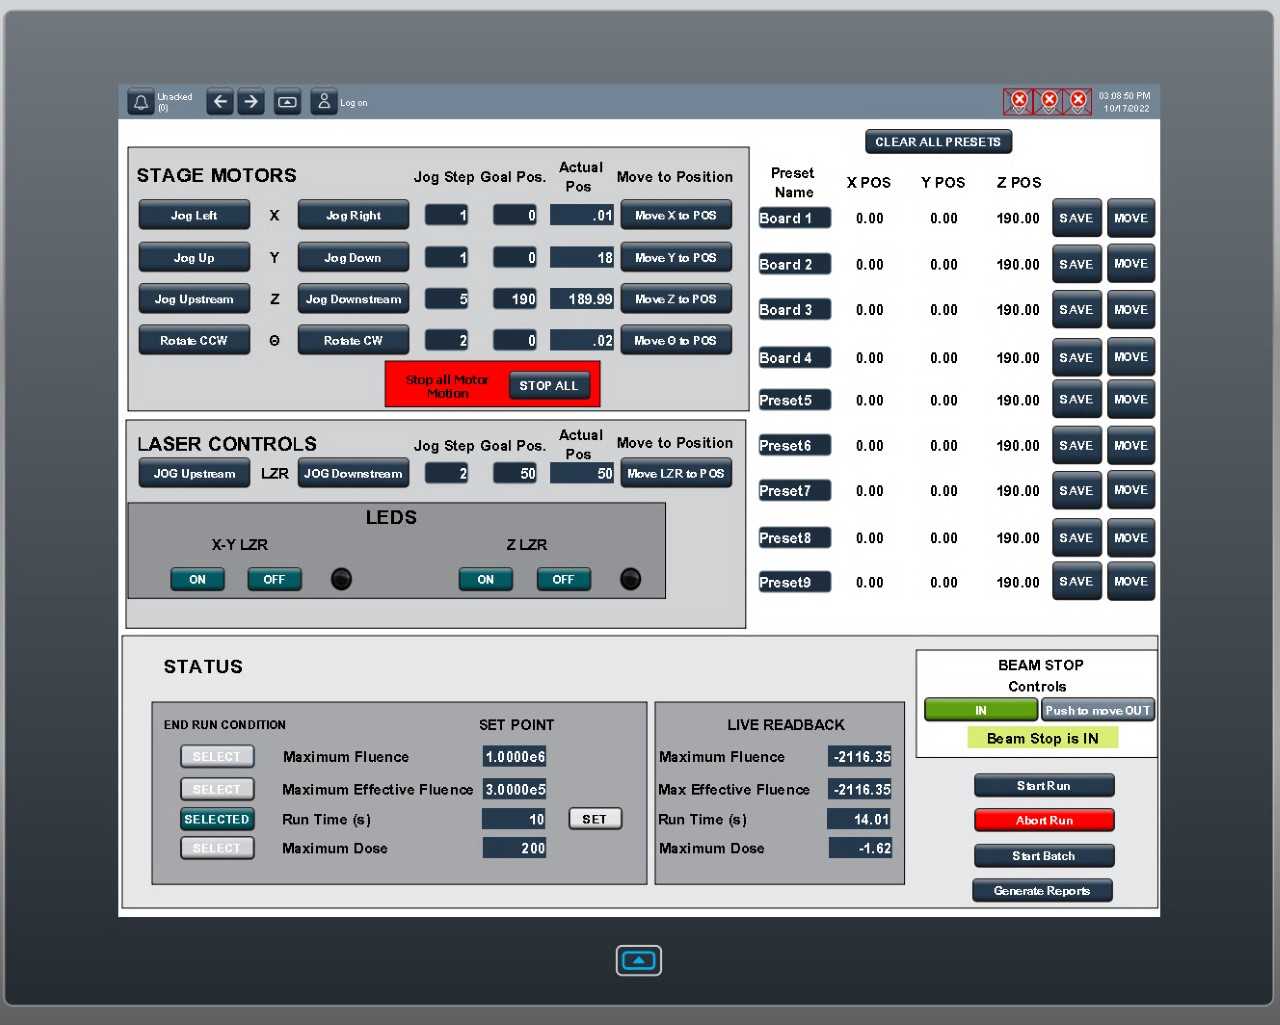
Industrial-standard and touch-panel-based controls allow for substantial user control, including device presentation, exposure shutter control, and beam/dose statistics.
The touch-panel control screen is shown below. This interface is provided in both the user control room and the beamline area, and is used to facilitate motion and position of devices. The beam exposure settings are defined on bottom left of the viewer. In the bottom right users are given batch control of run reports (start run) and may generate reports (generate report).
A system status monitor, which provides real time updates on the accelerator, beamline, and flux monitoring, is also included in the control room. Visible and infrared cameras monitor the user stage and provide visual feedback during stage motion. The status monitor also includes online flux and fluence monitoring. 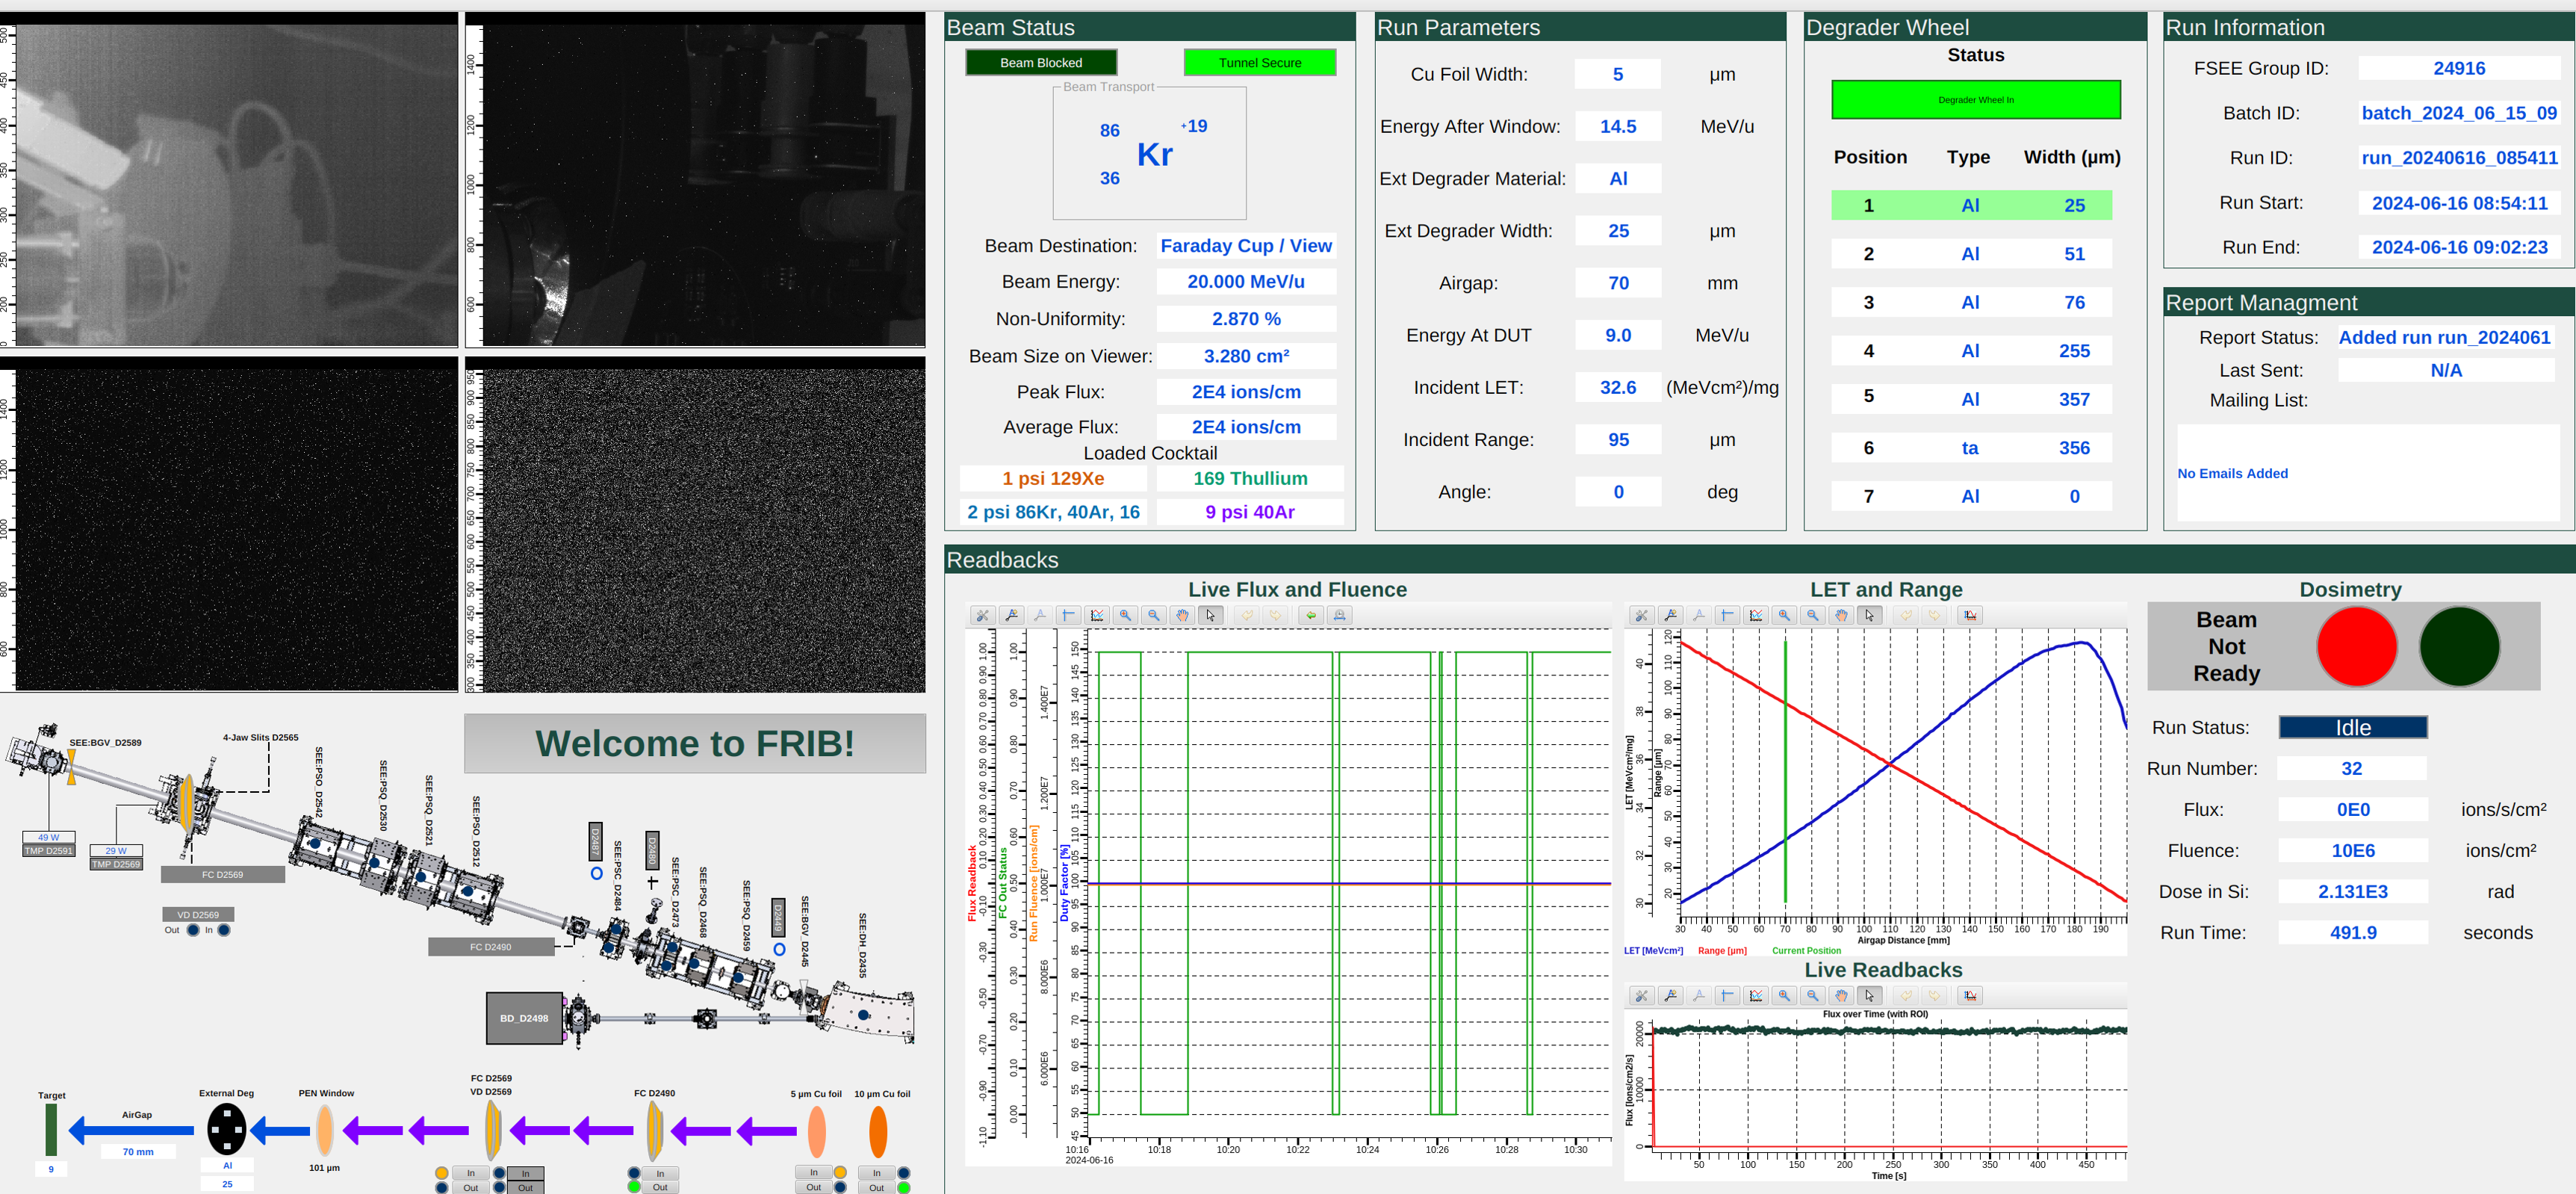
SEE user control rooms contain various conveniences to assist users throughout their shift such as:
- Multichannel bench top power supplies
- Soldering station
- Digital microscope
- 4-Channel, 200-MHz oscilloscope
- Assortment of hand tools, cables, connectors/adaptors
- Wi-Fi and Internet
- Refrigerator, microwave, and coffee machine
- Grounding points and ESD mats
SEE downloads
View current downloadable files relevant to the SEE Facilities.
SEE booking & logistics
Learn more information about requesting beam time at the SEE Facilities.